Existing reports can be edited to adjust them to changing requirements. So even if you customize your ADvendio.com system, you can adapt your reports.
| Anchor | ||||
|---|---|---|---|---|
|
...
To edit a report, go to the Reports tab and click the arrow button left of the report to select the action you want to perform. Click Edit to open the editing mode.
Add Fields as Columns and Filters
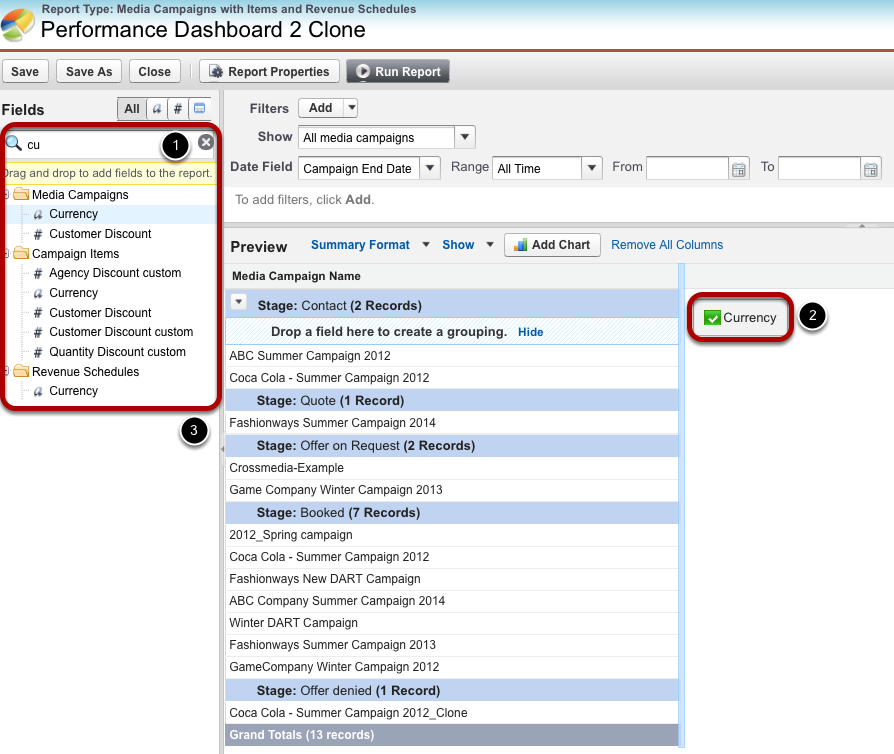
Components of reports are added and removed using drag & drop.
- If you know the field or object name you are looking for, enter the name in the quick search field. The available fields will automatically be limited to those containing the letters entered.
- Pick a field and add it to your report using drag & drop. You can add it as another column when you drag it into the preview section or you drag it into the filters section in order to add a new filter.
- To remove columns, drag them back into the list of available fields.
Filters
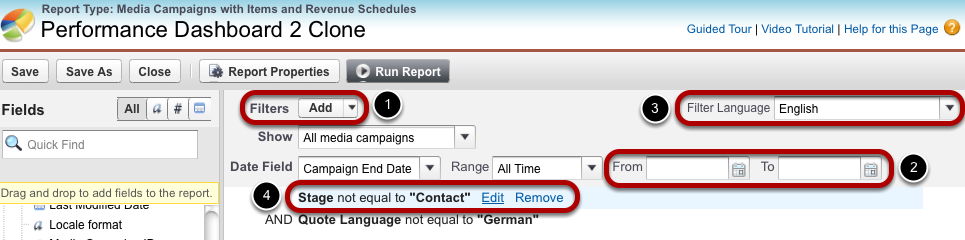
With filters you limit the data entries taken into account for this report.
- While you can add filters using drag & drop, you can also use the Add Filter drop-down menu for further filter options.
- The Date Field can also be limited, for example, to a certain period of time.
- Please note that filter language settings might need adjustment.
- To remove or edit a filter, hover over the filter and select one of the actions then displayed right of the filter description.
Data Formatting

While the summary format can group records by one category, the matrix format enables grouping by two categories.
If the preview looks fine, click Run Report. From there, you are able to export the report. Or you can click Customize to go back to this Editing Mode.
Click Add Chart to create a visualization of the report.
Chart Editor
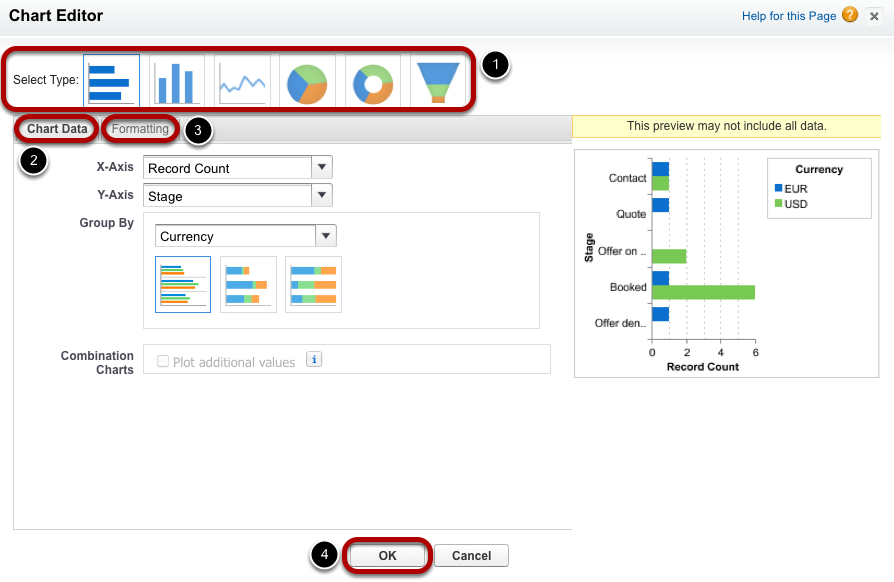
With the Chart Editor, you create a visualization of the report.
...
There are no restrictions how to work through these steps. You are always able to change the chart type or to switch back between Chart Data and Formatting.
Report Properties
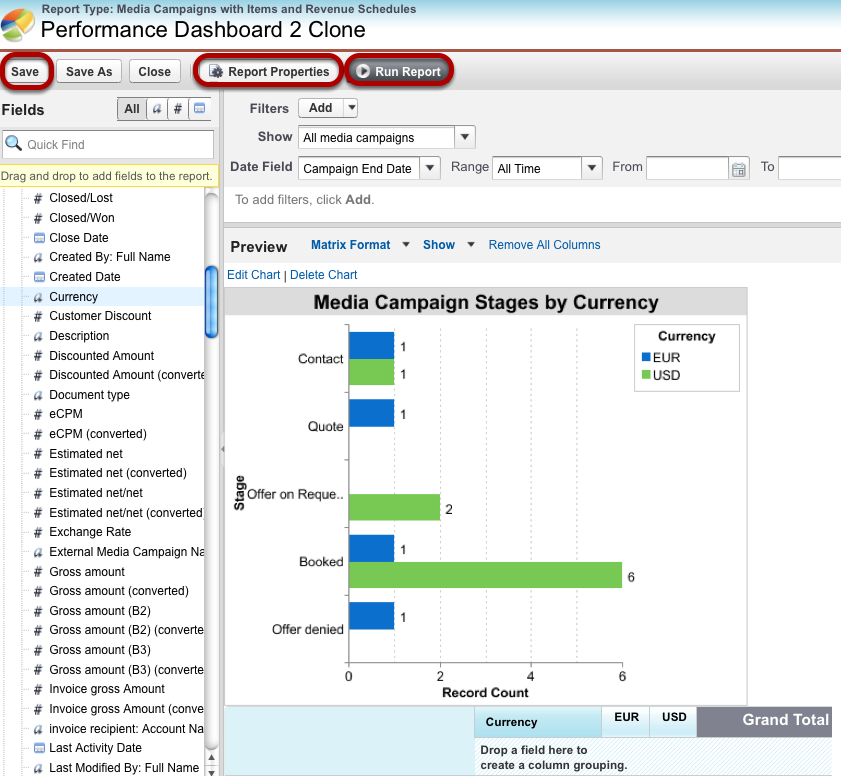
Now the report consists of both a matrix containing the data and a chart. If you click Run Report, both will be displayed.
Click Report Properties to change the report's name, add a description or change its visibility by placing it in a folder not visible to others.
Make sure to save your report.
...